Energy Monitoring from Edge Silicon to Cloud Analytics
CurrentUsage bridges high-performance CU100 ESP32-C3 hardware with an ultra-responsive DuckDB columnar cloud platform. Sample 4 CT current channels, monitor ambient thermals, stream sub-second MQTT metrics, and audit power trends with zero vendor lock-in.
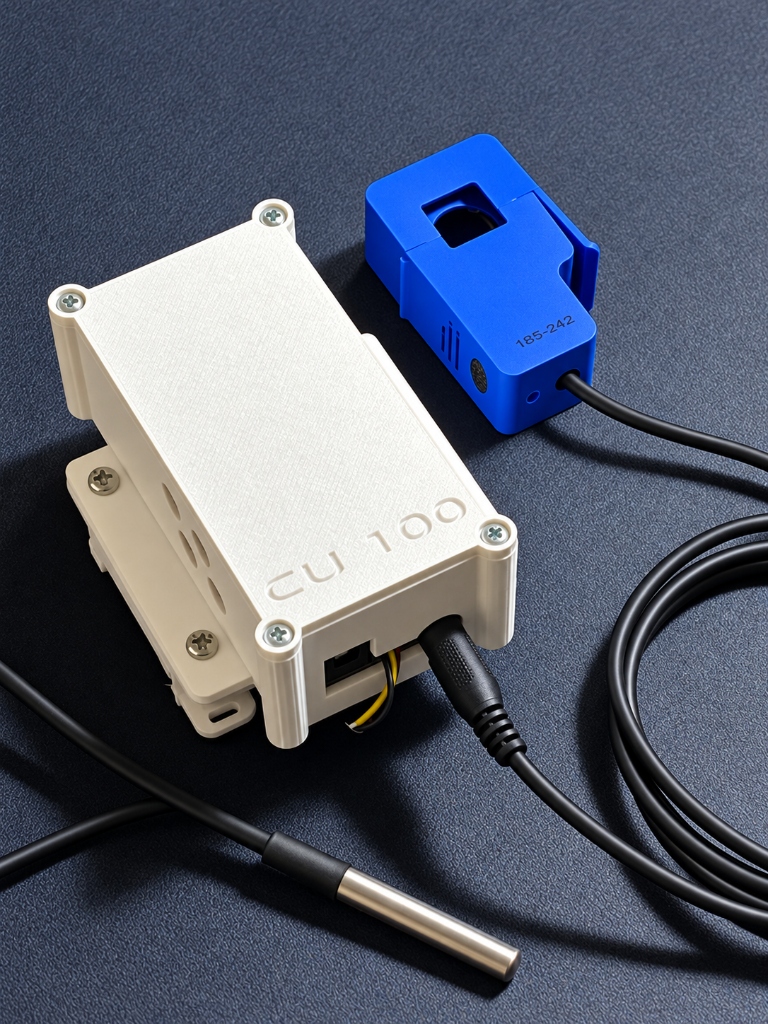
Engineered for Sub-Second Precision
From microvolt analog signals at the breaker panel to columnar analytical rollups in the cloud, CurrentUsage eliminates cloud latency and data monopolies.
CU100 ESP32-C3 Firmware
Runs native ESP-IDF v5+ firmware on a 32-bit RISC-V SoC. High-speed I2C continuous
sampling via ADS1115 16-bit ADC measures 4 differential CT clamp channels, calculates
True RMS, and polls DS18B20 1-Wire temperature. Features an embedded local HTTP web
server
with a real-time UI and /api/sensors REST endpoint for reading CT data
offline when cloud or internet connection is lost.
MQTT & WebSocket Bridge
Devices publish telemetry JSON payloads to cu100/<SERIAL>/state with
hardware Last Will and Testament (LWT) on status. An integrated Express
WebSocket bridge multiplexes streams to connected web clients with sub-50ms latency.
Hybrid Storage: DuckDB + SQLite
SQLite manages user authentication, bcrypt passwords, JWT cookies, device ownership, and API keys. DuckDB columnar engine handles millions of telemetry records with async memory buffering and blazing rollups (1m, 5m, 1h, 1d).
CU100 Hardware Specification
Engineered for continuous non-invasive electrical submetering. Click the interactive markers on the CU100 device to inspect on-board components.
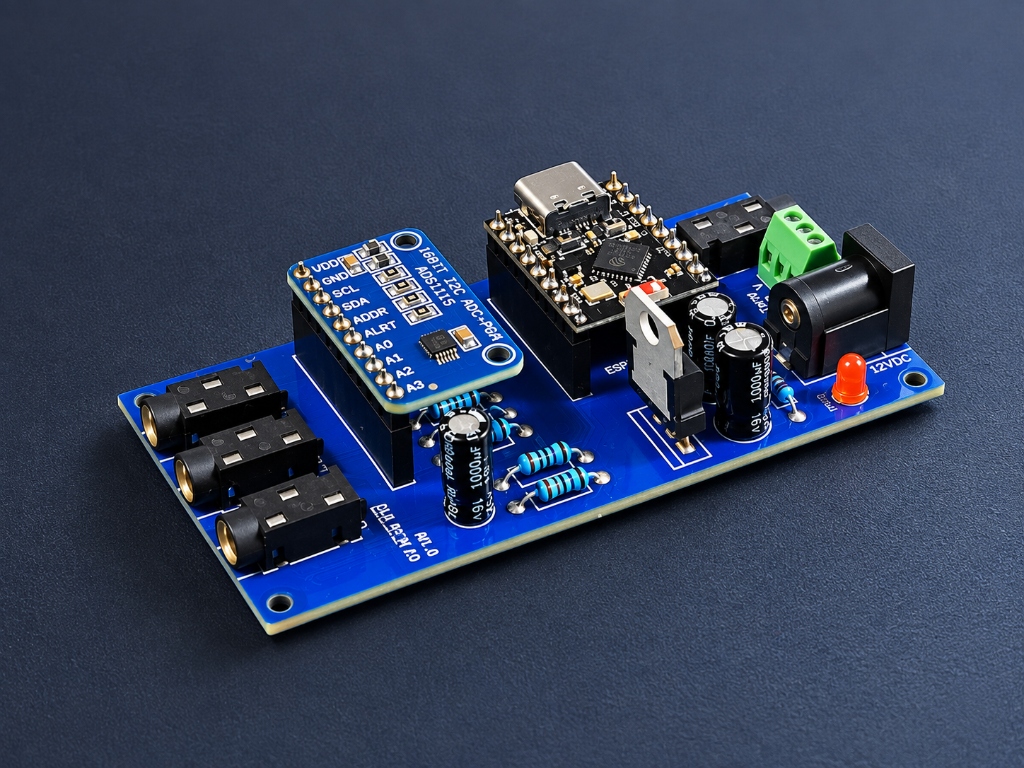
Espressif ESP32-C3 RISC-V SoC & USB-C
Single-core 32-bit RISC-V processor clocked at 160MHz with 400KB SRAM, 2.4GHz 802.11 b/g/n Wi-Fi, USB-C interface for flashing/debugging, and onboard status LED.
Hardware Pinout (ESP32-C3 GPIO)
The CurrentUsage Cloud Dashboard
A glassmorphic, real-time command center featuring adaptive dark & light themes, custom CT channel labeling, deep historical monthly billing analytics, and back-office administrative governance.
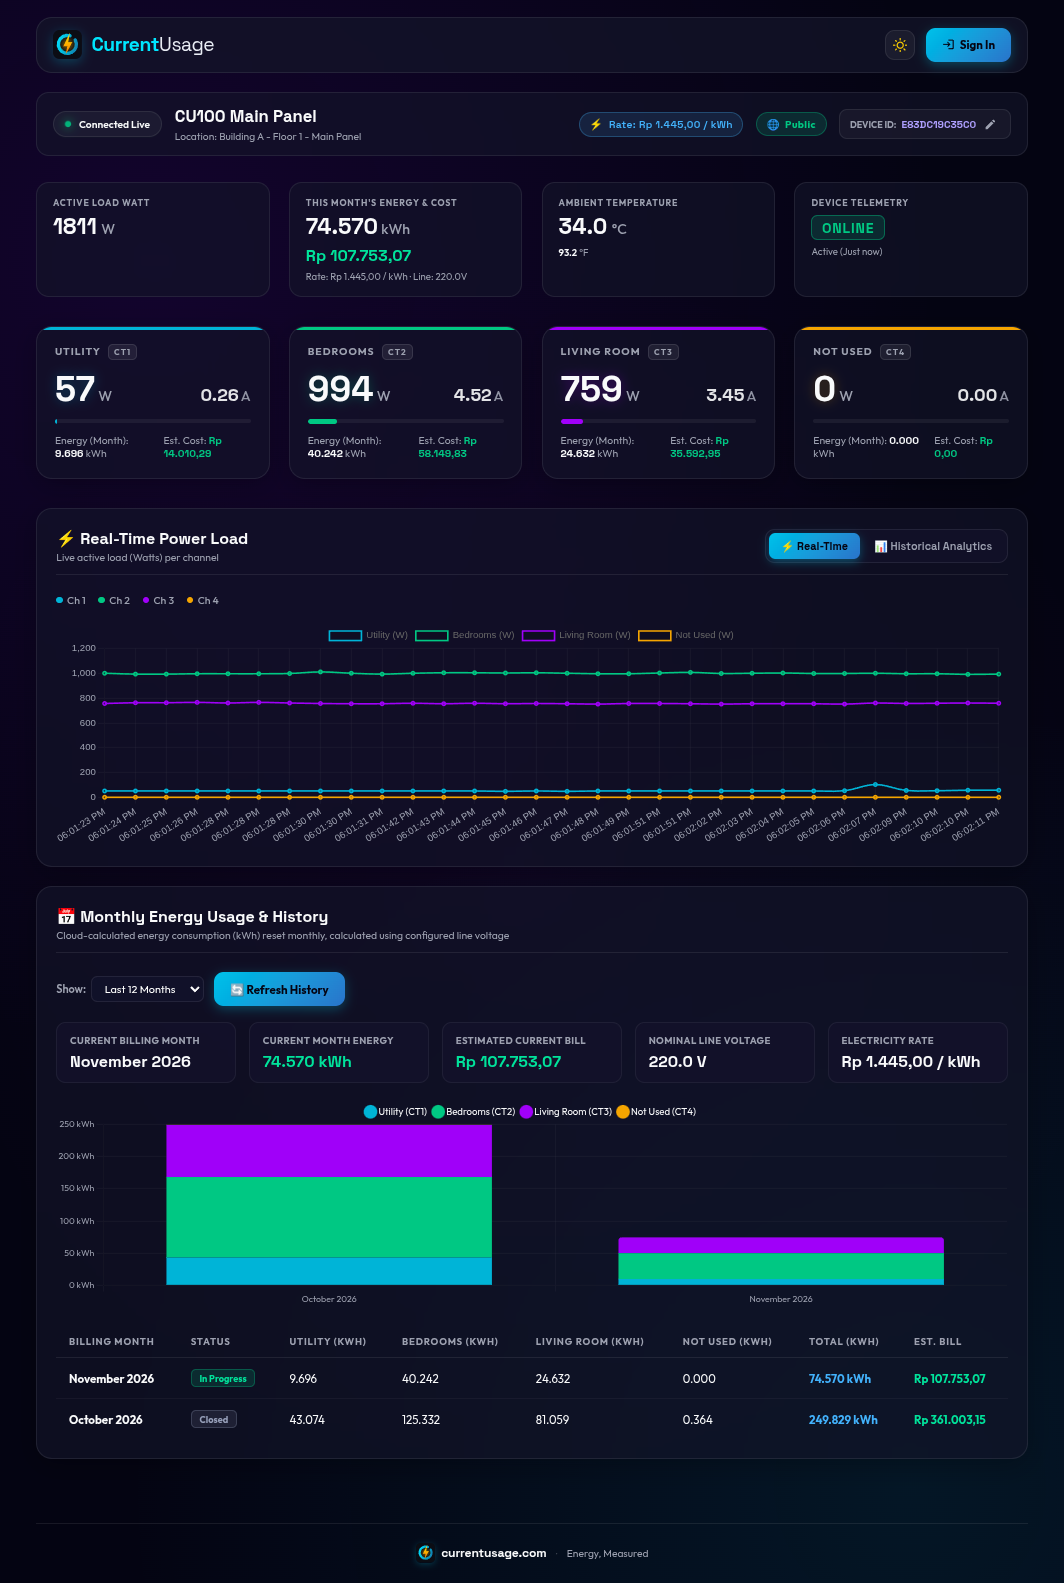
Sub-Second WebSocket Streaming
Telemetry updates push directly over WebSockets into animated neon dial gauges and live Chart.js power load lines with zero page refreshing.
DuckDB Columnar Analytics
Seamlessly transition between live streaming and multi-week historical rollups (1m, 5m, 1h, 1d downsampling) with sub-10ms query execution.
Historical Monthly Rates & Billing
Server-side energy (kWh) integration based on calibrated AC voltage. Automatically rolls up monthly consumption with configurable tariff rates, estimated costs, and 6, 12, 24-month, or all-time history filters.
Custom CT Channel Labeling
Assign friendly names to sensor lines (CT1–CT4) in device settings (e.g., AC Main, EV Charger, Kitchen Range). Labels immediately sync across live dials, charts, and breakdown tables.
Adaptive Dark & Light Themes
Seamless one-click switching between deep cyber-dark glassmorphism and crisp light mode. Features persistent storage, anti-FOUC zero-flash loading, and instant Chart.js palette synchronization.
Granular Privacy Controls
Toggle devices between Public 🌐 (see live example ↗) and Private 🔒 (strictly locked to authenticated owner and admin).
Automated Data Retention
Configurable per-user retention policies (7 Days, 30 Days, or 180 Days) enforced by an in-process daily scheduler that auto-prunes expired DuckDB rows.
Dedicated Admin Back-Office
Accessible at /admin. Full CRUD operations for provisioning accounts,
auditing global device inventories, and viewing tamper-evident admin audit logs.
Developer API & Tokens
Issue scoped API keys (cu100_sk_...) with SHA-256 server hashing for custom
Python automation, Grafana integrations, and automated reporting.
Instant QR Code Labels for Device Enclosures
Every registered CU100 device comes ready for physical field deployment. Print high-contrast QR labels directly from the web portal onto vinyl or standard sticker paper to affix to electrical subpanels, DIN rails, or 3D-printed cases.
npm run labels.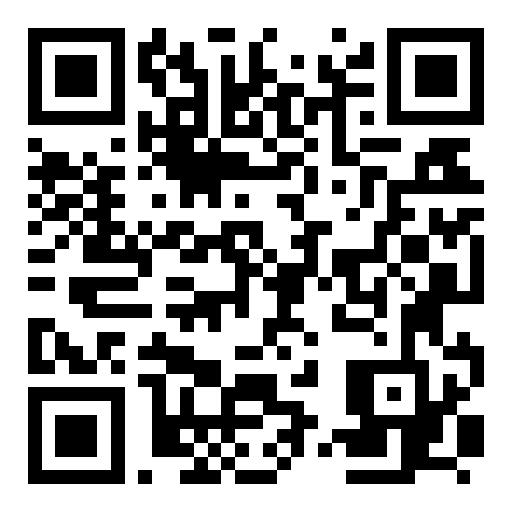
Get Started in Minutes
Select a stack tab below for instant commands, configuration examples, and integration snippets.
# 1. Navigate to the firmware workspace
cd cu100

# 2. Configure target for ESP32-C3 RISC-V SoC (first-time only)
idf.py set-target esp32c3

# 3. Build firmware binaries
idf.py build

# 4. Flash firmware & attach serial telemetry monitor
idf.py -p /dev/ttyUSB0 flash monitor

# Tip: Alternatively use the provided wrapper script:
./idf.sh build
./idf.sh -p /dev/ttyUSB0 flash monitor
# 1. Navigate to cloud dashboard directory
cd cloud-dashboard
# 2. Install backend dependencies (Node.js 18+)
npm install
# 3. Export mandatory JWT secret
export JWT_SECRET=$(openssl rand -hex 32)
export PORT=3000
export MQTT_HOST="messages.currentusage.com"
# 4. Start the hybrid Express + DuckDB server
npm start
# Server active at:
# User Portal: http://localhost:3000/
# Admin Office: http://localhost:3000/admin// Topic: cu100/<SERIAL_NUMBER>/state
// Status (LWT): cu100/<SERIAL_NUMBER>/status -> "online" | "offline"
{
"serial": "a4cf1289b0c4",
"v_rms": 230.5,
"i_rms1": 1.25, // Channel 1 Current (Amperes RMS)
"i_rms2": 0.45, // Channel 2 Current
"i_rms3": 3.80, // Channel 3 Current
"i_rms4": 0.12, // Channel 4 Current
"p_active": 1295.4, // Total Active Power (Watts)
"temp": 28.5, // DS18B20 Ambient Temp (°C)
"rssi": -62, // Wi-Fi Signal Strength (dBm)
"uptime": 3600 // Device Uptime (seconds)
}# Query downsampled time-series telemetry from DuckDB
curl -X GET \
"http://localhost:3000/api/devices/a4cf1289b0c4/history?range=24h&resolution=5m" \
-H "X-API-Key: cu100_sk_your_generated_secret_token" \
-H "Accept: application/json"
# Supported Ranges: 1h, 24h, 7d, 30d
# Supported Rollup Resolutions: raw, 1m, 5m, 1h, 1d# Direct offline access over local network or Access Point (No cloud or internet needed)
# Web Browser UI: Open http://<device-ip>/ or http://cu100.local/ in any browser
# Query real-time CT sensor telemetry via the on-device REST API:
curl -s http://192.168.1.120/api/sensors
# Live JSON Response:
{
"v_rms": 230.15, // Calibrated Grid Voltage (Volts RMS)
"i_rms1": 1.42, // CT Channel 1 Current (Amperes RMS)
"i_rms2": 0.38, // CT Channel 2 Current
"i_rms3": 0.00, // CT Channel 3 Current
"i_rms4": 0.00, // CT Channel 4 Current
"p_active": 414.27, // Total Active Power (Watts)
"temp": 28.4, // DS18B20 Ambient Temp (°C)
"rssi": -58, // Wi-Fi Signal Strength (dBm)
"uptime": 14400 // Device Uptime (seconds)
}# Add to your Home Assistant configuration.yaml (Works 100% offline via local LAN)
sensor:
- platform: rest
name: "CU100 Main Power"
resource: "http://192.168.1.120/api/sensors"
value_template: "{{ value_json.p_active }}"
unit_of_measurement: "W"
device_class: power
state_class: measurement
- platform: rest
name: "CU100 Grid Voltage"
resource: "http://192.168.1.120/api/sensors"
value_template: "{{ value_json.v_rms }}"
unit_of_measurement: "V"
device_class: voltage# Generate and print QR code asset labels for CU100 devices
# 1. Batch generate printable SVG QR labels for all registered devices:
cd cloud-dashboard
npm run labels
# Output directory: ./labels/
# Generated: qrcode-e83dc19c35c0.svg
# Encoded URL: https://dashboard.currentusage.com/?device=e83dc19c35c0
# 2. Dynamic QR Code API endpoint (SVG):
curl -s "http://localhost:3000/api/devices/e83dc19c35c0/qrcode" > device-label.svg
# 3. Print directly in browser:
# Navigate to User Dashboard > "My Registered Devices"
# Click "QR Code" icon to preview and print formatted 300 DPI stickerFrequently Asked Questions
Everything you need to know about setting up, calibrating, and extending CurrentUsage & CU100.
CU100-SETUP). Connecting with your
phone or laptop opens a local dashboard where you can enter your home Wi-Fi SSID, set
MQTT broker credentials, and fine-tune per-channel calibration multipliers against a
reference multimeter.
/?device=a4cf1289b0c4) can view real-time dials and
historical charts in read-only mode without being able to modify settings, claim
ownership, or access other devices.
http://<device-ip>/ or
http://cu100.local/ in any standard web browser. The on-device server
provides a responsive real-time status UI and a lightweight REST API
(/api/sensors) returning instantaneous RMS current for all 4 CT channels
(CT1–CT4), active power, line voltage, and ambient temperature—providing a reliable
alternative option with zero cloud dependency.
https://dashboard.currentusage.com/?device=e83dc19c35c0). You can generate
and print these labels directly from the web dashboard ("My Registered Devices" > "QR
Code") or batch-generate high-resolution vector SVGs using the CLI script
(npm run labels). The formatted label includes the CurrentUsage branding,
device serial number, CT specifications (4× SCT-013 100A:50mA), pinout, and 300 DPI
print-ready layout for physical enclosure sticker application.